Cardiac Magnetic Resonance (CMR)
- First description of T2-weighted CMR findings in children with myocarditis by Gagliardi et al in 1991 [2]
- Offers anatomical visualization,
quantitative accuracy with interobserver consistency and myocardial tissue analysis.
- Sensitivity of cardiac magnetic resonance is best within the first 2 weeks of disease onset.
[5]
Indications (CMR)
Consensus for performing CMR if: [2]
- symptomatic
-
- new or persisting symptoms suggestive of myocarditis (dyspnea,
orthopnea,
palpitations,
effort intolerance,
malaise,
chest pain)
- clinical evidence for myocarditis
-
- Evidence for recent/ongoing myocardial injury (ie,
ventricular dysfunction,
new or persisting ECG abnormalities,
elevated troponin
- Unknown etiology of symptoms (i.e.
recent systemic viral disease or previous myocarditis,
absence of risk factors for coronary artery disease or age ‹35 years,
symptoms unexplained by stenosis on coronary angiogram,
recent negative ischemic stress test)
- the CMR result will likely affect clinical management
MR findings in myocarditis
Multiples findings are reported at CMR in cases of myocarditis:
- functional abnormalities
- morphological abnormalities
- pericardial effusions
- myocardial edema
- myocardial hyperperfusion (early gadolinium enhancement (EGE))
- myocardial necrosis/fibrosis (late gadolinium enhancement (LGE))
The latest CMR diagnosis criteria for myocarditis,
the Lake Louise Consensus criteria,
were introduced in 2009 and are summarized below : [2]
|
Diagnostic CMR criteria for myocarditis : Lake Louise Consensus Criteria (adapted from Friedrich et al.)
|
|
In the setting of clinically suspected myocarditis,
CMR findings are consistent with myocardial inflammation,
if at least 2 of the following criteria are present :
- regional or global myocardial SI increase in T2-weighted images* (edema)
- increased global myocardial early gadolinium enhancement ratio between myocardium and skeletal muscle in gadolinium-enhanced T1-weighted images* (hyperemia)
- there is at least one focal lesion with non-ischemic regional distribution in IR-prepared gadolinium-enhanced T1-weighted images (late gadolinium enhancement)* (necrosis, fibrosis)
* these criteria being further specified in the Cardiovascular Magnetic Resonance in Myocarditis : A JACC White Paper article
|
|
A CMR study is consistent with myocyte injury and/or scar caused by myocardial inflammation if :
|
|
The presence of LV dysfunction or pericardial effusion provides additional,
supportive evidence for myocarditis
|
Inflammation can be predicted or ruled out with diagnostic accuracy of 78% if ≥2 criteria present (only 68% of diagnostic accuracy if only LGE imaging is performed).
[2]
Functional abnormalities [2]
- Very reproducible assessment of right and left ventricular (LV) function
- Even mild functional abnormalities can be identified,
quantified,
and followed
- Global LV dysfunction is frequently seen in patients with more severe myocarditis.
- Regional or less severe LV wall motion abnormalities have a low specificity for the underlying pathophysiology of myocarditis.
[2]
Morphological abnormalities
- A transient increase of wall thickness can be seen in myocarditis; can be used as a supportive finding.
[2]
- Transient subtle increase of LV volume can be observed in the course of myocarditis and can also serve as a retrospective,
supportive evidence for myocarditis (Fig.
1).
[2,
5]
- Decrease of LV mass during the recovery of uncomplicated myocarditis found to be associated with edema as assessed by T2-weighted CMR (retrospective).
[2]
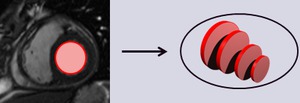
Fig. 1: Transient increase in LV volume found in the course of myocarditis, with subsequent decrease (return to normal) of the LV volume during the recovery phase.
Pericardial effusions [2]
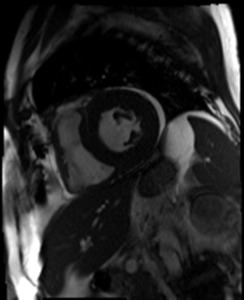
Fig. 2: Short-axis view of a patient with myocarditis showing pericardial effusion (high signal intensity) surrounding mostly the lateral wall of the LV.
EDEMA
- Edema is not specific for myocarditis but implies acute injury
- Edema itself can cause harm : increased interstitial hydrostatic pressure → capillary compression → necrosis → cardiac function impaired [1]
- Edema visible in 36% of patients with histologically "active myocarditis”
- Limited sensitivity in less severe inflammation
Edema Imaging Principles [2]
- Early imaging is best since edema can be present for 2-3 weeks
- Increased permeability of cellular membranes when inflammatory cell injury (Fig.
3)
- From intracellular edema (Na+ influx) to efflux of water + leakage of large molecules (troponin) [2]
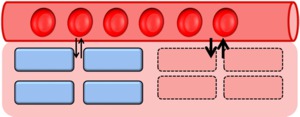
Fig. 3: Myocardial cells with increased membrane permeability (red rectangular cells) secondary to inflammatory injury.
- T2-weighted imaging detects tissue edema (contrast-generating mechanism: long T2 of water-bound protons) (Fig.
4) [2]
- Short-axis views often provide better image quality than long-axis views [2]
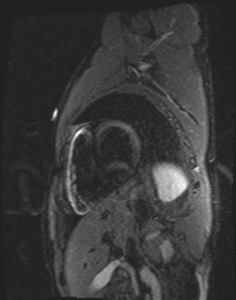
Fig. 4: Short-axis T2 sequence showing hypersignal corresponding to edema, mostly located in the anterolateral mid left ventricular wall.
- Artifacts related to intraventricular blood signal in apical slices limit their utility (Fig.
5).
- Black blood preparation aims at suppressing this slow blood flow hypersignal (predominant at LV apex).
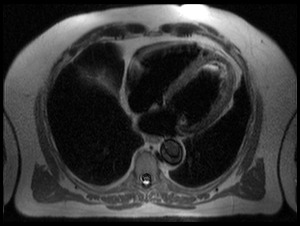
Fig. 5: Axial view of a T2 sequence showing slow blood flow at LV apex, manifested as high signal area.
Useful sequences
Triple IR-T2: Black Blood Preparation + Fat suppression preferably used [1,
2]
- Myocardium: isosignal
- Fat: no signal
- Cavity: no signal
- Suppress fat signal (STIR) (Fig.
6)
- Increase edema visualization
- Lower SNR,
which depends on motion artifacts
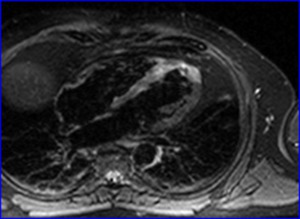
Fig. 6: Axial STIR showing increased signal corresponding to edema in the apical and septal regions of the LV.
Double IR-T2: Black Blood Preparation
- Myocardium: isosignal
- Fat: hypersignal
- Cavity: no signal
- higher SNR
Possible global myocardial distribution of edema in myocarditis warrants a quantitative signal intensity analysis of the entire myocardium,
since it may be more difficult to recognize otherwise.
[2] Normalizing the signal intensity of the myocardium to that of skeletal muscle is recommended [1] :
(SI myocardium/ SI skeletal muscle) with T2 ratio ≥ 1.9 as cutoff value for myocarditis [2]
SNR of T2-weighted images limits their ability to identify small regions of edema and involvement of skeletal muscles (systemic inflammation) may decrease sensitivity of this finding.
HYPEREMIA
Hyperemia imaging principle - early gadolinium enhancement (EGE)
- Presently regarded as the best CMR related predictor in patients with suspected myocarditis.
- Tissue inflammation is associated with regional vasodilatation : increased blood volume leads to increased uptake of contrast agents during the early vascular phase.
[2]
- Increased signal intensity results,
especially within the first 2 minutes [1] ; washout predominates after a 3-4 minutes steady state.
[1]
- The purpose of myocardial early gadolinium enhancement ratio (EGEr) is to detect an overall increased volume of gadolinium distribution into the intravascular and interstitial spaces during the early washout period. [2]
- Can be seen up to 4-6 weeks after onset of disease.
[1,
5]
Useful sequences for early gadolinium enhancement
- Contrast-enhanced fast spin echo T1-weighted MR
- Black blood preparation (Double IR – T1)
- Myocardium: Isosignal
- Fat: Hypersignal
- Cavity: No signal
- Gadolinium sensitivity
- Fast spin-echo sequences vulnerable to varying heart rate and irregular breathing patterns
- Good SNR
Quantitative evaluation of myocardial EGEr [1]
- Normalization of the myocardial signal intensity in T1-weighted images to that of skeletal muscle to obtain the EGEr
- Abnormally increased EGE ratio if ≥ 4 [1]
- May be hampered in patients with evidence for skeletal muscle involvement (signal intensity increase of 20% or higher)
- an absolute myocardial signal intensity increase between pre-gadolinium and post-gadolinium images of more than 45% should be used as a threshold consistent with myocarditis instead of the normalized myocardial early gadolinium enhancement ratio.
[2]
LATE GADOLINIUM ENHANCEMENT (LGE)
- LGE reflects early and late myocardial irreversible injury (necrosis and fibrosis).
[2,
6,
7]
- Early stage: visualization of myocardial necrosis (in severe acute myocarditis) by gadolinium entering the cells through acutely injured membrane (volume of distribution is increased) (Fig.
7).
[2]
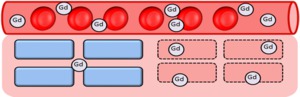
Fig. 7: In severe acute myocarditis, visualization of myocardial necrosis is explained by gadolinium entering the cells through acutely injured membrane (volume of distribution is increased).
- Later stage: visualization of fibrosis ; clearance of necrotic regions replaced by fibrocytes with a large interstitial component (also increasing the volume of distribution for gadolinium).
[2]
Patterns of LGE in active myocarditis
- Multiple focal hypersignal foci are typically localized to the subepicardial regions [7] of the left ventricle (Fig.
8-9) mostly in the inferolateral and less frequently in the anteroseptal segments.
- Can also be diffuse or regional.
[6]
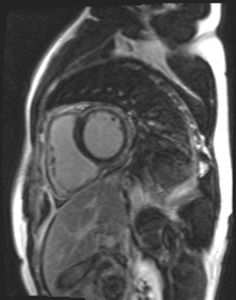
Fig. 8: Short-axis delayed-enhancement in the same patient as in Figure 4, showing abnormal enhancement (increased signal intensity) involving the areas of T2 hypersignal (seen in Figure 4), mostly in the anterolateral mid left ventricular wall.
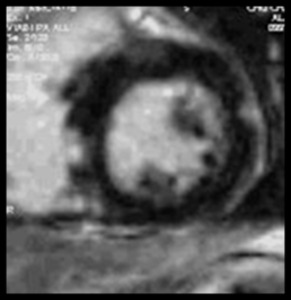
Fig. 9: Short-axis delayed-enhancement showing subepicardial nodular foci of enhancement in the septal and lateral left ventricular wall.
!!! Left ventricular outflow tract (LVOT) and membranous septum may mimic LGE in the basal septum in short axis.
!!! A line of increased signal intensity may appear in the basal septum on transverse,
long axis or short axis images which may not represent pathologic LGE but may be related to the fusion of the right ventricular moderator band to the right ventricular portion of the interventricular septum.
Topography of LGE is crucial and allows differentiation between ischemic (typical subendocardial involvement) and non-ischemic injury.
- There is typical subepicardium involvement in myocarditis (Fig.
10),
clearly distinguishing this injury pattern from ischemia-mediated injury,
where mandatory subendocardium involvement is seen (Fig.
11).
[2,
6]
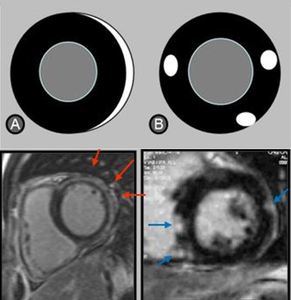
Fig. 10: Focal and multifocal patterns of late gadolinium enhancement in myocarditis : focal hypersignals are typically localized to the subepicardial regions, more commonly at the inferolateral segments.
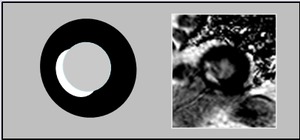
Fig. 11: Short-axis LGE MR showing subendocardial late enhancement related to ischemia-mediated injury.
- Involvement of subepicardium more important than subepicardial predominance
- 16% of patients with suspected acute myocarditis have myocardial infarction (chest pain,
troponin elevation,
normal coronary angiogram) (Gahide et al.
European radiology 2010).
Useful sequences : Inversion-recovery sequence principle and value
- Inversion pulse serves to decrease signal response from normal myocardium,
thereby highlighting areas with increased accumulation of gadolinium as bright regions.
(Fig.
12)
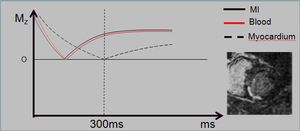
Fig. 12: Inversion pulse to decrease signal response from normal myocardium, highlighting areas of enhancement.
- LGE imaging is the gold standard for in vivo detection of irreversible myocardial injury associated with myocardial infarction.
[2]
- Does not differentiate acute from chronic inflammatory myocardial injury.
[1]
- High specificity in myocarditis demonstrated in many previous studies.
[2,
6]
- Variable sensitivity; LGE may be insensitive for the detection of symptomatic myocarditis with limited or non-focal irreversible injury.
[2]
- Using the Dallas criteria,
De Cobelli et al (J Am Coll Cardiol,
2006)found:
- LGE sensitivity = 84% in active myocarditis
- less sensitive in “borderline” myocarditis (44%) [1,
2]
Time delay after gadolinium perfusion
- Found to be reliable from 5 minutes to up to 30 minutes after gadolinium perfusion in myocardial infarction (MI) [8] (Fig.13)
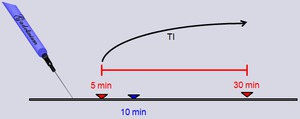
Fig. 13: Findings of delayed-enhancement were found to be reliable from 5 minutes to up to 30 minutes after gadolinium injection in myocardial infarction (MI).
- Differences in gadolinium kinetics in myocarditis and acute myocardial infarction : [9]
- volume of blood decreases in the core of a myocardial infarct
- volume of blood increases in acute myocarditis.
- In myocarditis,
the contrast between enhanced and normal myocardium (Cenhanced-normal) is higher and image quality has been recently demonstrated better 5 minutes after injection of gadolinium compared with the 10 and 15 minutes time-points used for myocardial infarction.
[9]
Gadolinium-Enhanced Cine MR : a newly proposed approach
Based upon unpublished personal results:
- 68 patients (29 women; mean age 38.5 ± 14.4 years)
- Myocardial enhancement assessed on both contrast-enhanced (CE) Cine MR done shortly after gadolinium injection and delayed-enhancement (DE) imaging
- CE Cine MR confirmed positive DE imaging findings in 96.6% (n=28/29),
located in the same segments with a Pearson’s correlation coefficient of enhanced surfaces of 0.91 (Fig.
14-18)
- CE Cine MR increased the detection of myocardial lesions by 27.6%
- CE Cine MR seems more sensitive than DE imaging
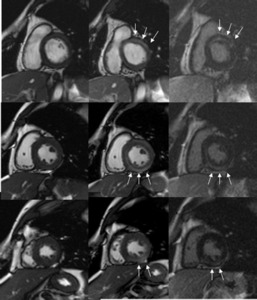
Fig. 14: Correlation of findings of myocardial enhancement on CE Cine MR and DE MRI.
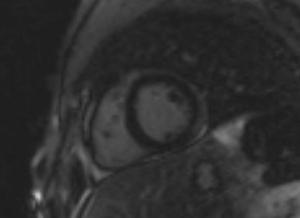
Fig. 15: Single-shot delayed-enhancement short-axis view showing increased signal involving the subepicardium of the mid and apical anterolateral wall in a 20 y.o. male patient with myocarditis.
Fig. 16: Cine MR short-axis view in the same 20. y.o. patient as in Figure 15 showing increased signal intensity involving the subepicardium of the mid and apical anterolateral wall of the LV, that correlates with the myocardial enhancement seen on the single-shot delayed-enhancement sequence also done in that patient.
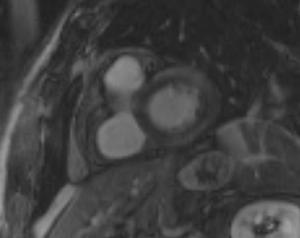
Fig. 17: Delayed-enhancement short-axis view in a 40 y.o. patient with myocarditis (that proved to be related to streptococcal A infection - rheumatic fever) showing increased signal intensity in the basal mostly anterolateral (but almost circumferential) LV wall involving 25-50% of the myocardial thickness.
Fig. 18: CE cine short-axis view in the same 40 y.o. patient with myocarditis as in Figure 17 showing increased signal intensity also affecting the anterolateral basal LV wall and involving 25-50% of the myocardial thickness.
Proposed protocol in suspected acute myocarditis (Fig.
19)
Performing Cine MR after gadolinium perfusion
→ Shortens the examination time by 5 to 10 minutes
→ Increases the sensitivity in depicting myocardial lesions
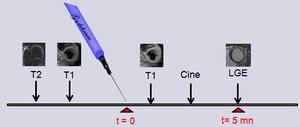
Fig. 19: Proposed CMR protocol for suspected acute myocarditis, with CE cine MR performed after gadolinium injection before LGE at 5 minutes.
A recent study in 18 patients with suspected myocarditis [10] also showed that CE cine sequences were as accurate as LGE in detecting acute myocarditis.
They found good correlation between :
- Locations of the abnormalities
- Surface areas of the abnormalities observed
- SNR and CNR of acute myocarditis lesions were significantly higher on CE cine images than on late gadolinium-enhanced images.
[10]
→ Suggest that CE Cine sequences can be used to detect the lesions of acute myocarditis rapidly and efficiently,
a few minutes after gadolinium injection (compared with use of the standard late gadolinium-enhanced sequence).
